Databricks Lakehouse Ingestion Patterns With Streaming CDC
Capture only the changes that matter using CDC patterns tailored to your latency needs.
An operational database holds the live state of a business: every order placed, every balance updated, every record changed a moment ago. If Databricks queries that system directly at production scale, it either slows the system down or reprocesses rows that never changed. The obvious fix, a scheduled full-table extract, creates its own compounding mess: repeated full scans burn compute, they add hours of latency before fresh data lands, and they flatten the order in which changes happened, which downstream systems often need to reconstruct correctly. CDC solves the core problem a different way: it reads only what actually changed, using logs the database already keeps for its own recovery, not extra queries or triggers bolted on after the fact. CDC is not one thing, though. The pattern that carries those changes into Databricks sets the latency, the operational load on the team running it, how schema changes get handled, and which medallion layer receives the data first, and picking the wrong one trades the problems of batch for a different set of problems.
The three CDC ingestion patterns available to Databricks practitioners
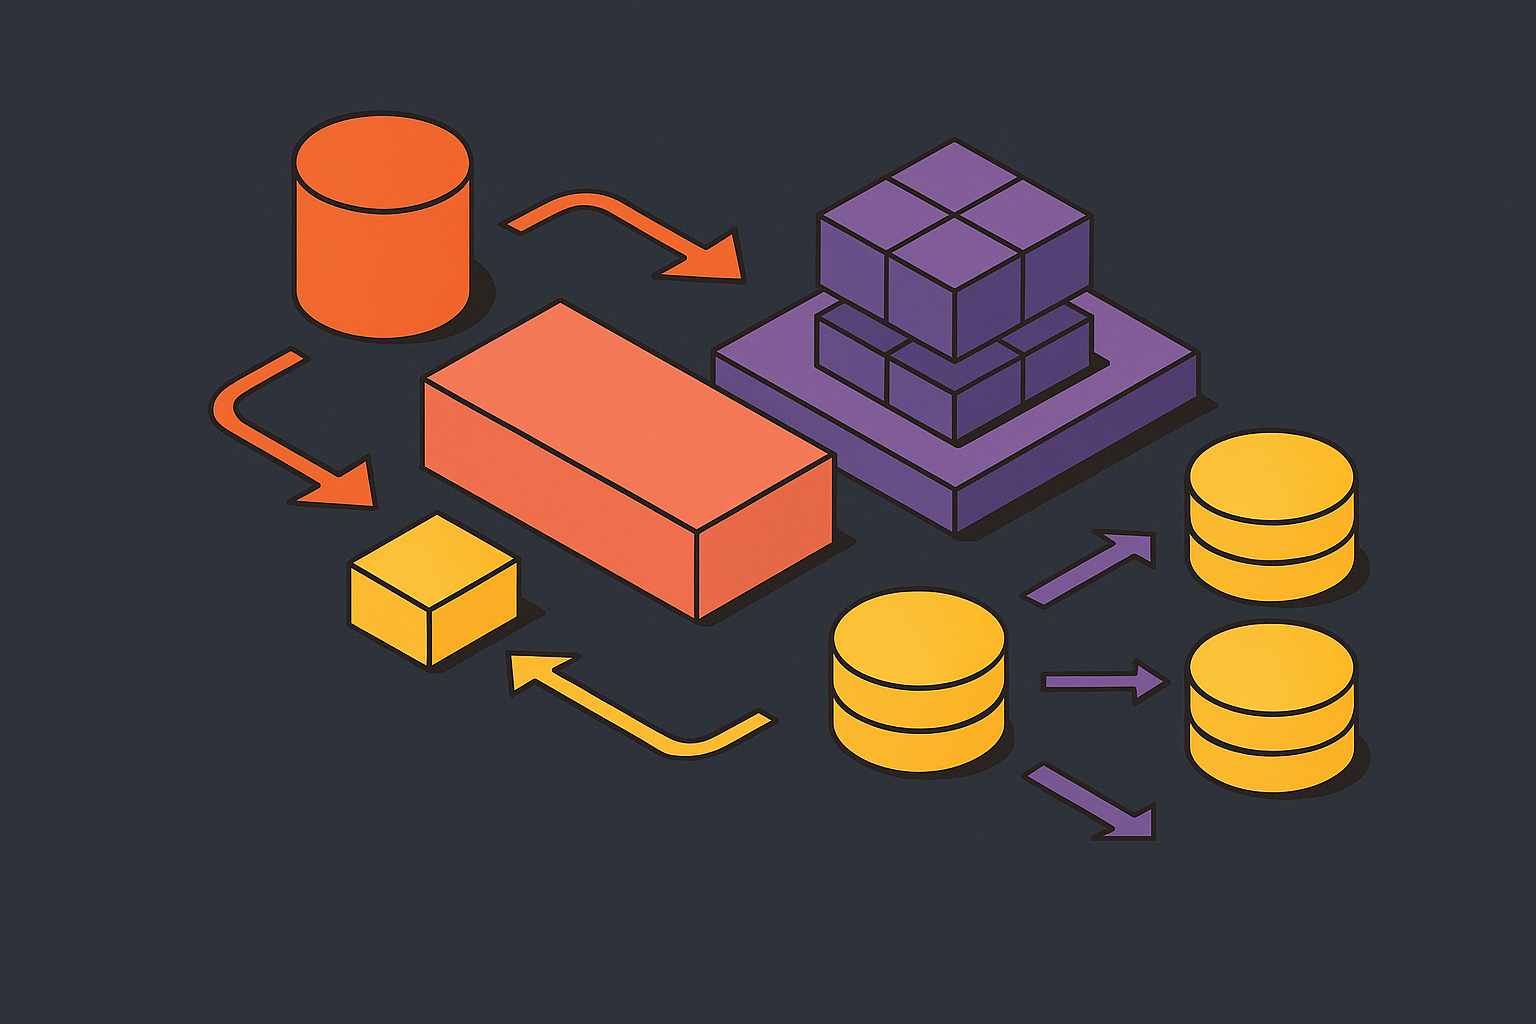
Three distinct patterns exist for getting CDC events into a Databricks lakehouse, and they diverge on where the change event lands first, how it travels from there, and which Databricks component finally consumes it.
The first pattern is log-based streaming straight into Structured Streaming. A CDC tool reads the database's transaction log, whether that's a write-ahead log, a binlog, or an oplog, and streams row-level change events directly into Databricks, usually passing through Kafka, Kinesis, or Azure Event Hubs as the transport layer in between.
The second pattern routes CDC events through cloud storage first. The CDC tool writes change events as files, JSON, Avro, or Parquet among them, to S3, ADLS, or GCS, and Auto Loader discovers and processes those files incrementally into Delta tables using file notification or directory listing. End-to-end latency typically runs one to five minutes, and it depends on how often the source flushes files.
The third pattern keeps everything inside the Databricks platform. Lakeflow Connect and Lakeflow Spark Declarative Pipelines handle replication and upsert logic natively, using AUTO CDC INTO to materialize changes into Delta tables without standing up external infrastructure.
Each pattern occupies a different point on the spectrum between latency and operational burden, and none of the three is the right answer for every team. The sections that follow take each in turn.
Pattern 1: Log-based streaming through Kafka or Kinesis into Structured Streaming
This pattern delivers the lowest latency of the three, and it asks the most of the team that runs it. A CDC tool reads the source database's transaction log and pushes row-level change events into a message bus, Kafka, Kinesis, or Event Hubs, and Structured Streaming reads continuously from that bus, handling state, fault tolerance, and throughput internally. Databricks' own reference architecture treats streaming sources, CDC processes included, as a first-class input to Structured Streaming, on the same footing as sensor data and IoT telemetry. On AWS specifically, the reference architecture names AWS IoT Core, Amazon Kinesis, and AWS DMS as supported streaming ingest paths into the platform.
Log-based capture wins out over the two older approaches to finding database changes. Query-based CDC polls the source on a schedule to find rows that changed, so it adds load to the production database, and it misses deletes unless the schema already carries a soft-delete flag. Trigger-based CDC writes to shadow tables on every insert, update, and delete, which amplifies writes, and it breaks easily whenever the schema changes underneath it. Log-based CDC avoids both failure modes, because it reads a log that the database already keeps for its own crash recovery. It does not lock tables, and it does not run extra code against the data on every change, so it keeps the load on the production system minimal.
The costs show up on the operational side, not the latency side. PostgreSQL deployments carry a specific risk around replication slots: once a slot is created, the database cannot discard WAL segments until the CDC consumer has read them, because the slot pins those segments in place. If the consumer goes down for an extended stretch, WAL keeps accumulating on disk, and it can fill the server's storage and crash the database. You need active monitoring and a real slot-cleanup procedure for that risk, not a one-time setup step. Choosing this pattern also means provisioning, monitoring, and scaling the Kafka cluster itself (or its managed Kinesis or Event Hubs equivalent), on top of running the CDC reader and the Spark job that consumes from it. Managed CDC platforms take that cluster management off a team's plate, and that is the real operational difference: you either run the infrastructure yourself, or you pay someone else to run it. Delivery guarantees add one more layer of work: CDC systems built to be reliable guarantee at-least-once delivery, so no event gets lost, but duplicates can appear during failover. The Spark job on the receiving end needs idempotency or explicit deduplication logic, or those duplicates will double-count downstream.
In the medallion architecture, events from this pattern land raw in bronze straight out of Structured Streaming, and silver is where deduplication, quality checks, and schema enforcement actually happen, with gold handling aggregation after that. The pattern earns its complexity for teams with sub-minute latency requirements, teams that already run Kafka infrastructure for other purposes, or teams feeding event-driven consumers, ML feature stores or real-time dashboards among them, that need to tap the same stream Databricks is reading from.
Database-specific mechanics that affect how Pattern 1 behaves in production
Each source database carries its own replication mechanics and failure modes, which a team only learns in production if it treats every source as interchangeable.
PostgreSQL supports both physical, block-level replication and logical, row-level replication, and CDC relies on the logical kind, which decodes the WAL into row-level change events and ships them through a publish-and-subscribe model. Logical replication works across major PostgreSQL versions, and it can replicate a subset of tables rather than the whole database, so it can do things physical replication cannot. The sharpest pitfall sits in replica identity: for an UPDATE or DELETE to replicate correctly, the publisher has to be able to identify the specific row on the subscriber side, and by default it relies on the primary key to do that. A published table with no primary key will fail at the publisher with a replica identity error the moment an update or delete tries to go through, so any table lacking one needs to be fixed before replication gets turned on. DDL changes do not travel through logical replication at all: an ALTER TABLE statement has to be applied by hand on both sides, and the safe sequence adds new columns to the subscriber first, so incoming change events don't error out against a schema that hasn't caught up yet. PostgreSQL's own version history tracks the maturity of this feature closely. PostgreSQL added logical replication in version 10. Row and column filtering on publications arrived in version 15. Version 16 let you run logical replication from standby servers, and subscribers could apply large transactions in parallel. Version 17 shipped pg_createsubscriber, a tool for converting an existing physical replica directly into a logical one.
MongoDB takes a different path. Every replica set member keeps an oplog, a capped collection in its local database that records changes for replication purposes, and Change Streams, introduced in MongoDB 3.6 with database- and deployment-level support added in MongoDB 4.0, expose a cursor-based API that lets applications subscribe to changes without reading the oplog directly. Because the oplog is capped, a consumer that falls too far behind can drop off the end of it entirely, and recovering from that means a full re-snapshot of the collection rather than a simple resume from where the consumer left off.
DynamoDB shows up in Databricks' AWS reference architecture as a supported operational source, with DynamoDB Streams serving as its change feed mechanism. Swiggy's CDC system is a concrete case of this working at scale: the company used AWS DMS for MySQL sources and AWS Lambda paired with DynamoDB Streams for DynamoDB sources, building a system for low-latency incremental processing across business-critical pipelines.
Any CDC tool reading MySQL's binary log depends on it being configured correctly first. Statement-based logging is a poor fit for CDC because non-deterministic functions can produce different results on replay, so row-based logging with binlog_row_image=FULL is the setting that matters, since it writes both the before and after image of every modified row. GTID mode, short for Global Transaction Identifiers, makes binlog position tracking reliable across failovers, which matters directly for recovery when a CDC consumer reconnects after an outage. Binary log retention needs to be set long enough that the CDC tool can finish its initial snapshot before old logs get purged, because if it isn't, the snapshot races against log rotation and can lose that race.
Pattern 2: CDC events written to cloud storage and consumed by Auto Loader
Writing CDC events to cloud object storage before Databricks touches them costs some latency, but it buys real operational simplicity, and for a large share of workloads you should make that trade. The CDC tool writes change events, as JSON, CSV, XML, Avro, Parquet, ORC, TEXT, or BINARYFILE files, to Amazon S3, Azure Data Lake Storage, or Google Cloud Storage as it captures them from the source log. Auto Loader then processes new files incrementally as they land, using the cloudFiles Structured Streaming source with either file notification or directory listing to find new arrivals. It also infers schema automatically and merges new columns into the stored schema as CDC events introduce them, though the stream needs to restart, automatically through Lakeflow Jobs or Declarative Pipelines, or by hand, before those new columns become usable. End-to-end latency typically runs one to five minutes, and it depends on how the source flushes files.
The real advantage here is decoupling. The CDC tool and Databricks no longer depend on each other directly: a Databricks cluster restart or a paused pipeline doesn't touch the CDC tool at all, and files simply accumulate in storage until Auto Loader is ready to pick them up again. That tolerance for downstream delay is worth a lot to teams running clusters that get resized, paused, or restarted on a schedule. The cost is a hard floor on latency: file flush intervals set a minimum delay that no amount of Spark tuning can shrink, so teams that need sub-minute freshness cannot get there through this pattern no matter how the pipeline is tuned.
In the medallion architecture, files land raw in bronze, Auto Loader's checkpointing guarantees that each file gets processed exactly once, and silver-layer validation and deduplication follow from there. Databricks' own ingestion guidance recommends Auto Loader specifically for cloud storage files at scale, and it points to Lakeflow Connect and Structured Streaming for database and event-bus patterns respectively, so you can treat this pattern as a supported architectural choice, not a stopgap. It wins for teams without existing Kafka infrastructure, for workloads where one-to-five-minute freshness is good enough (daily reporting layers, ML training pipelines refreshed every few minutes), and for any architecture where operational simplicity outranks shaving the last minute of latency.
Pattern 3: Native Databricks pipelines with AUTO CDC and Lakeflow Connect
Databricks' native pipeline tooling now handles CDC ingestion, upsert logic, schema evolution, and slowly changing dimension tracking entirely inside the platform, without a separate Kafka cluster or an external CDC tool managing files in storage. Lakeflow Connect provides managed connectors for replication, and Lakeflow Spark Declarative Pipelines handle the pipeline logic, with AUTO CDC INTO materializing changes directly into Delta tables.
If you worked from older documentation or training material, you need to know that the API names underneath this pattern have changed. You should read current Databricks documentation rather than older tutorials, because a pipeline written against outdated naming will not match what the platform expects today. For teams whose source systems and volume profile fit within what the native connectors support, this pattern removes an entire category of infrastructure, no Kafka cluster to provision, no separate CDC tool to monitor, no file-landing zone to manage, while still delivering changes through a supported, documented path straight into Delta.
When you choose among these three patterns, you weigh latency against the operational weight your team can carry, and you match that weight to what the downstream use case needs. A dashboard refreshed every few minutes doesn't need the same architecture as a fraud-detection feature store reading off a live Kafka stream, and no single pattern serves both well.